What Does Solar Panel Installation Cost in 2026?
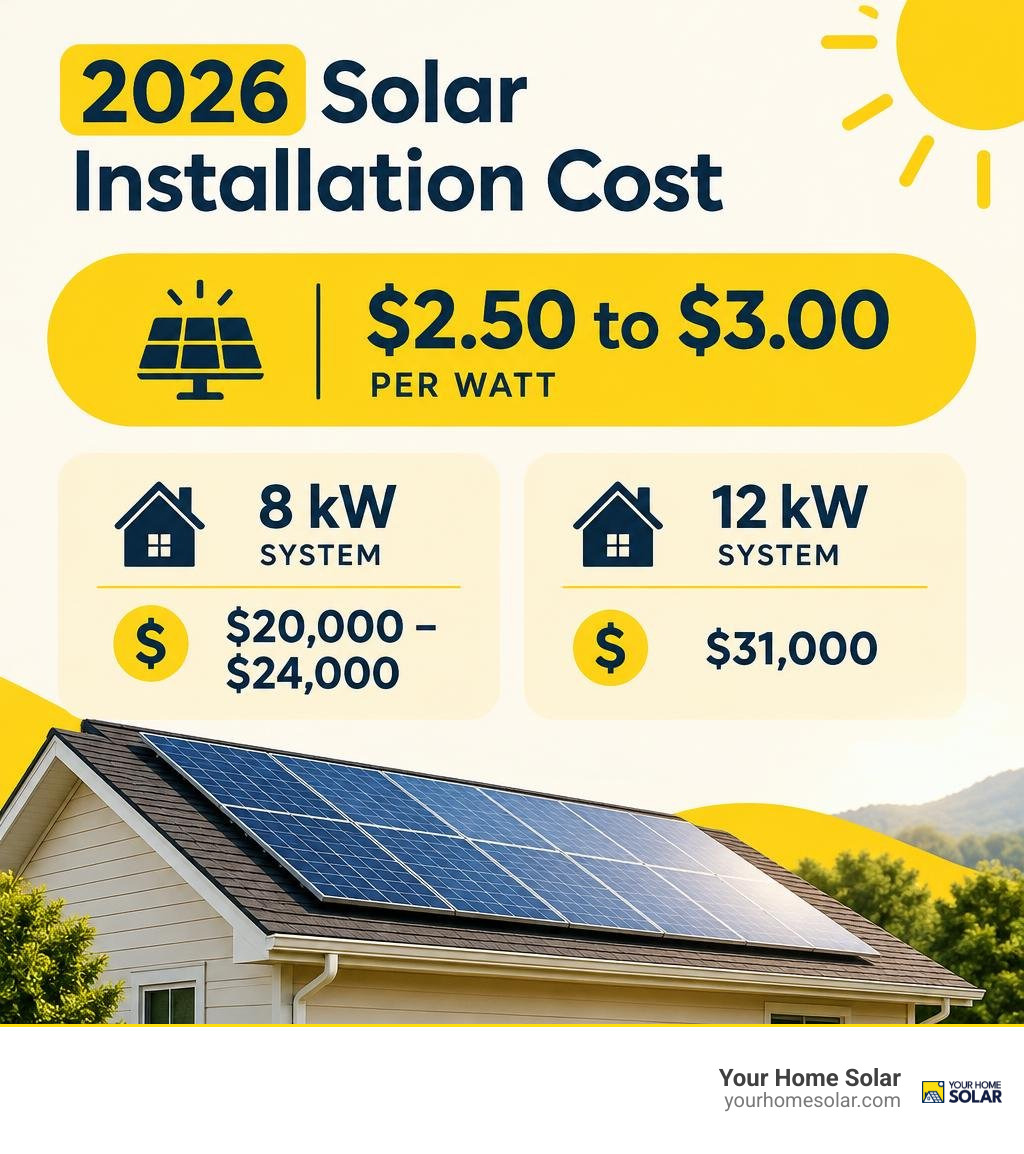
The average cost of solar panel installation in 2026 is roughly $2.50 to $3.00 per watt before incentives. That puts an 8 kW home system at about $20,000 to $24,000 and a 12 kW system at around $31,000. Your price will depend on how much power your home uses, your roof, and what the quote includes.
For East Tennessee homeowners, the best starting point is your electric bill, not a national average. This guide will help you compare quotes, spot extra costs, and estimate how long it may take for solar to pay for itself.
I’m Ernie Bussell, founder and CEO of Your Home Solar. My years leading solar operations and helping homeowners plan installations have taught me that the average cost of solar panel installation is useful only when you know what your own system needs.
Quick average cost of solar panel installation terms:
Breaking Down the Average Cost of Solar Panel Installation in 2026
When planning your budget, looking at broader market trends reveals that solar panel costs in 2026 have stabilized into predictable ranges. Nationally, the median cost for a turnkey residential system hovers around $2.60 to $2.78 per watt. For typical single-family homes requiring anywhere from 6 kW to 12 kW of capacity, gross project costs generally fall between $16,000 and $34,000 before local incentives or utility programs are factored in.
To help you visualize how capacity translates into total expenditure, the table below provides a quick reference across standard residential system sizes:
| System Size (kW) | Approximate Wattage Output | Average Gross Cost Range (at $2.60–$2.90/W) | Typical Home Size / Energy Profile |
|---|---|---|---|
| 5 kW | 5,000 Watts | $13,000 – $14,500 | Modest energy usage / small footprint |
| 8 kW | 8,000 Watts | $20,800 – $23,200 | Average suburban home |
| 10 kW | 10,000 Watts | $26,000 – $29,000 | Moderate-to-high consumption |
| 12 kW | 12,000 Watts | $31,135 – $34,800 | Larger home, high cooling or heating needs |
| 15 kW | 15,000 Watts | $39,000 – $43,500 | Heavy electric usage, EV charging, pool |
Understanding these baseline figures allows you to plan your budget with confidence, ensuring you get a fair price for the equipment and workmanship required.
How System Size Impacts the Average Cost of Solar Panel Installation
The overall capacity of your system is the single largest determinant of your total project price. System size is measured in kilowatts (kW), representing the peak power capacity of the solar array. The larger your home’s annual electricity consumption (measured in kilowatt-hours, or kWh), the more panels you will need to offset your utility bills.
Because solar installations benefit from economies of scale, larger arrays often carry a lower price per watt. Fixed expenses—such as engineering design, permitting, truck rolls, and administrative labor—are spread out over more panels. Examining installed panel prices shows that while an 8 kW system costs more overall than a 5 kW array, the cost per watt of energy capacity is often noticeably lower on the larger system.
Cost per Watt Benchmarks and Regional Pricing Variations
Cost per watt serves as the universal standard for comparing solar quotes, neutralizing differences in system capacity. According to recent residential solar market research, pricing variations across states and municipalities stem from differences in local supply chains, regional labor costs, permitting complexities, and sun irradiance levels.
In Tennessee, local market dynamics, utility interconnection rules, and competitive labor rates mean that systems generally price out near the national baseline. Evaluating quotes using the cost-per-watt metric prevents you from overpaying for equipment packages that may include hidden markups.
Hard Costs vs. Soft Costs: Where the Money Goes
A common misconception is that the physical solar panels make up the bulk of your invoice. In reality, the photovoltaic modules account for only about 12% of the total installation price. The remainder is distributed across other equipment, specialized labor, and operational overhead.
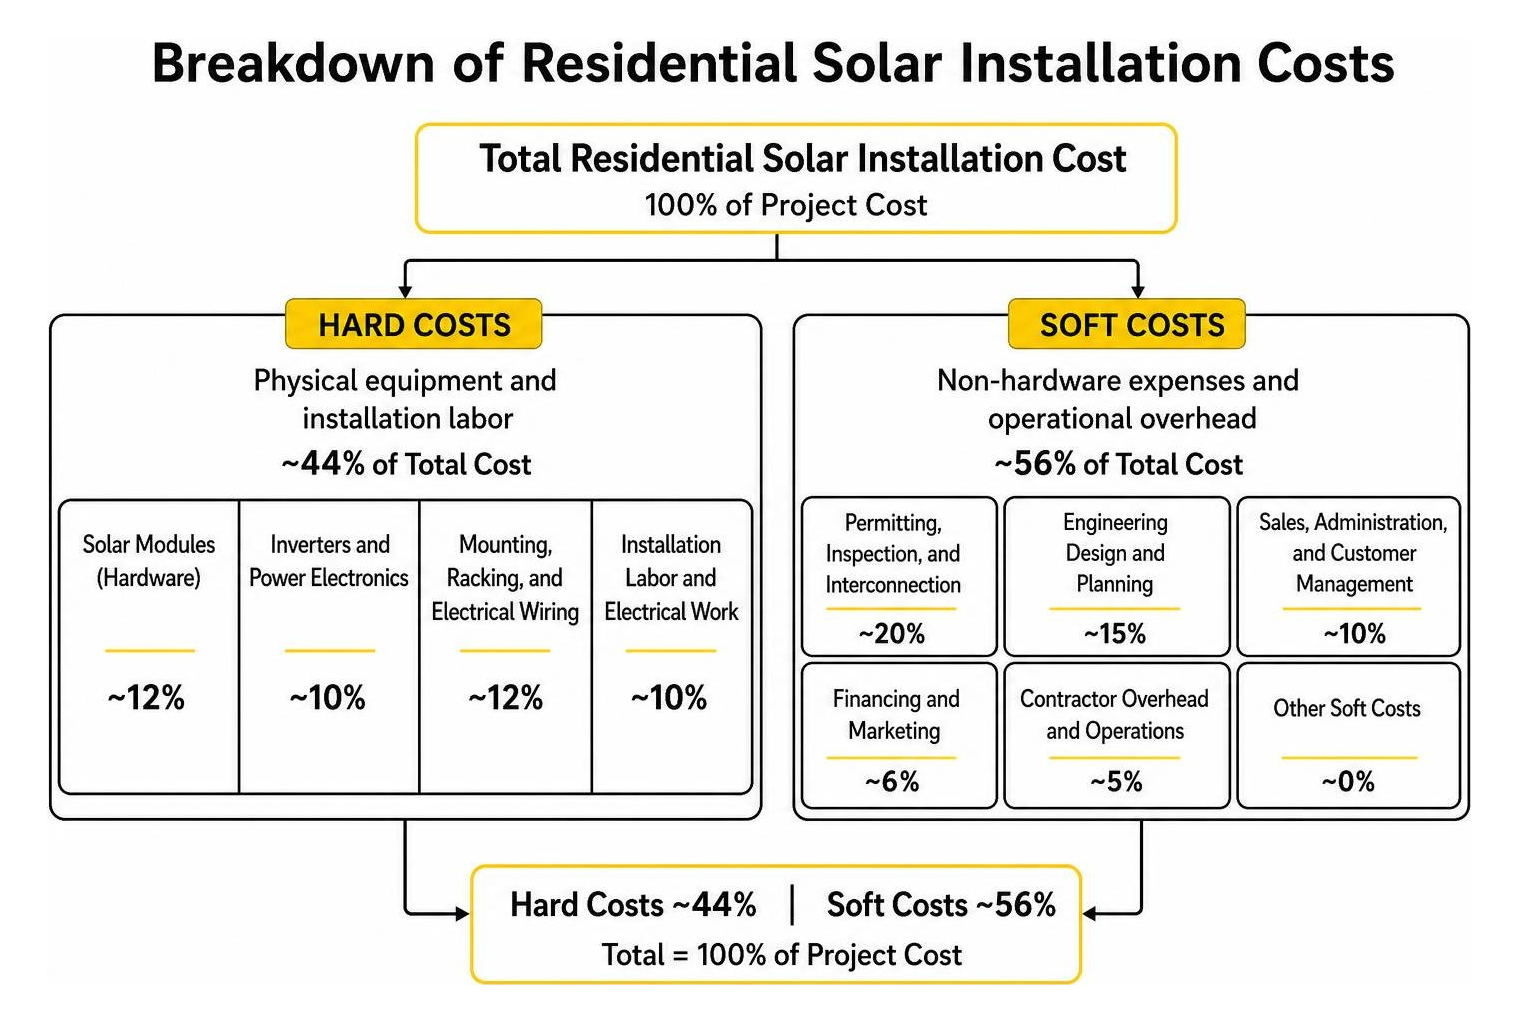
Here is how the total cost breaks down across typical residential installations:
- Solar Modules (Hardware): ~12%
- Inverters and Power Electronics: ~10%
- Mounting, Racking, and Electrical Wiring: ~12%
- Installation Labor and Electrical Work: ~10%
- Permitting, Engineering, and Utility Interconnection: ~8%
- Sales, Marketing, and Customer Acquisition: ~18%
- Operational Overhead and Logistics: ~19%
- Installer Profit Margin: ~11%
Soft costs—everything outside of the bare physical hardware—make up over half of the final investment. Partnering with a streamlined local team helps reduce marketing overhead while ensuring premium component selection.
Key Factors That Influence Your Total Solar Investment
Every roof is unique, and no two home energy setups are identical. When unpacking solar costs, we evaluate structural layout, electrical service, and roof geometry during an initial on-site evaluation to ensure long-term performance.
Roof Condition, Complexity, and Orientation
Your roof’s pitch, azimuth (the compass direction it faces), and layout directly impact installation difficulty and energy yield:
- Orientation: South-facing roof planes receive the most consistent sun exposure throughout the day, maximizing kilowatt-hour production. East- and west-facing planes remain viable but may require a few extra panels to match the same output.
- Roof Pitch and Planes: A simple, single-pitch gable roof is straightforward to work on. Multi-tiered, steep, or hip roofs require additional flashing, specialized safety staging, and complex conduit runs.
- Shading and Tree Cover: Nearby trees casting shadows can reduce solar production. In some cases, microinverters or power optimizers are deployed to isolate shaded panels so the rest of the array continues operating at peak capacity.
- Structural Integrity: Evaluating roof installation costs is critical before mounting an array. If your shingles are near the end of their lifespan, replacing or repairing them beforehand prevents the expense of detaching and resetting the solar array later.
What Additional Expenses Alter the Average Cost of Solar Panel Installation?
Beyond the standard panels and racking, certain site-specific upgrades can influence your initial budget:
- Main Electrical Panel Upgrades ($1,500 – $4,000): Older homes with 100-amp service panels frequently require an upgrade to a 200-amp panel to safely manage dual-source electric currents.
- Tree Trimming or Removal ($400 – $2,000): Clearing overhanging limbs improves sun exposure and protects your modules from falling debris.
- Backup Generators and Storage Integration: Homeowners seeking seamless whole-home resilience often integrate standby backup generators alongside their solar setup to ensure continuous power during grid outages.
- Critter Guards and Snow Guards ($300 – $800): Protective mesh around array perimeters prevents birds and squirrels from nesting under warm panels and damaging electrical wiring.
Professional Installation, Permitting, and Safety
While DIY equipment kits might seem cost-effective on paper, grid-tied residential installations demand certified electrical expertise. Professional installers manage jurisdictional building permits, secure structural engineering stamps, coordinate utility interconnection agreements, and uphold strict National Electrical Code (NEC) compliance. Working with a dedicated team also secures comprehensive workmanship warranties that protect your home from roof leaks and electrical faults for decades.
Solar Economics: Payback Periods, Lifetime Savings, and ROI
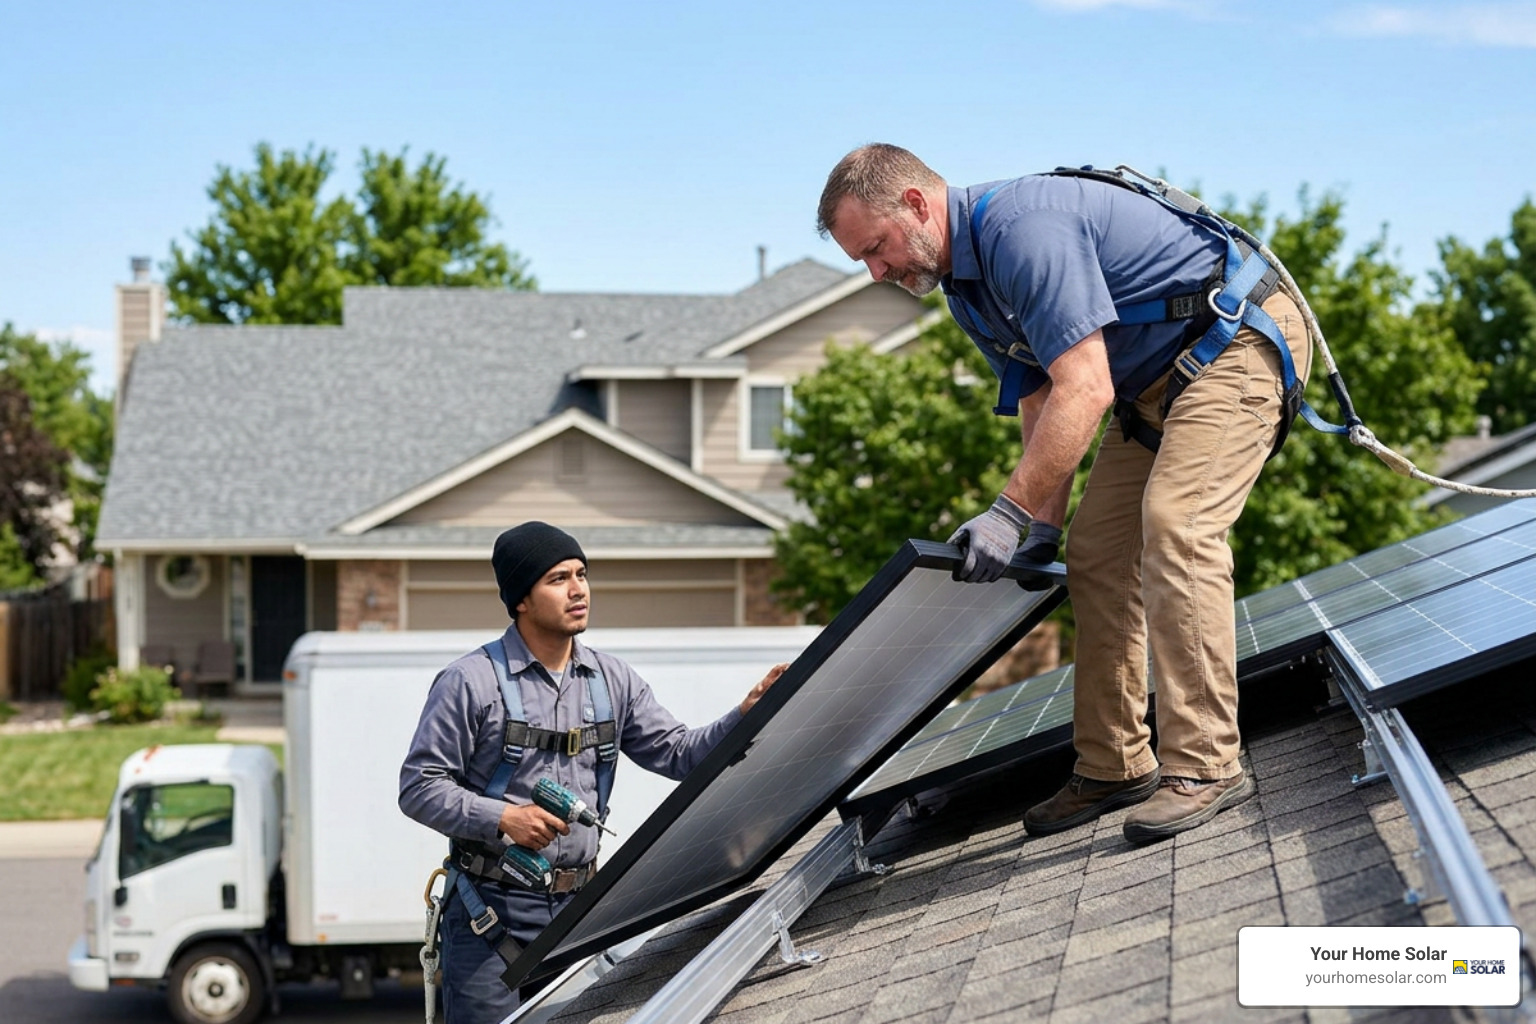
Reviewing the average costs for home solar alongside your monthly utility bills highlights solar as an asset-building home improvement rather than an ongoing expense.
Calculating Payback Periods and Breakeven Timelines
Your solar breakeven point occurs when the cumulative electricity savings generated by your array equal the net upfront investment. As highlighted in independent financial analysis of solar panel value, residential systems typically reach full payback within 8 to 12 years.
You can estimate your payback period by dividing your net initial installation cost by your estimated annual electricity savings. For instance, if your net system cost is $21,000 and your array offsets $2,100 per year in electricity expenses, your breakeven timeline is exactly 10 years. Because retail electricity rates climb over time, annual savings expand each year, often accelerating your true payback timeline.
25-Year Utility Bill Savings vs. Upfront Expenses
Modern Tier 1 photovoltaic modules feature 25- to 30-year performance warranties, degrading at a modest rate of roughly 0.5% per year. Over a standard 25-year operational lifecycle, most homeowners avoid between $41,000 and $155,000 in cumulative electric utility charges, depending on system size and baseline power consumption.
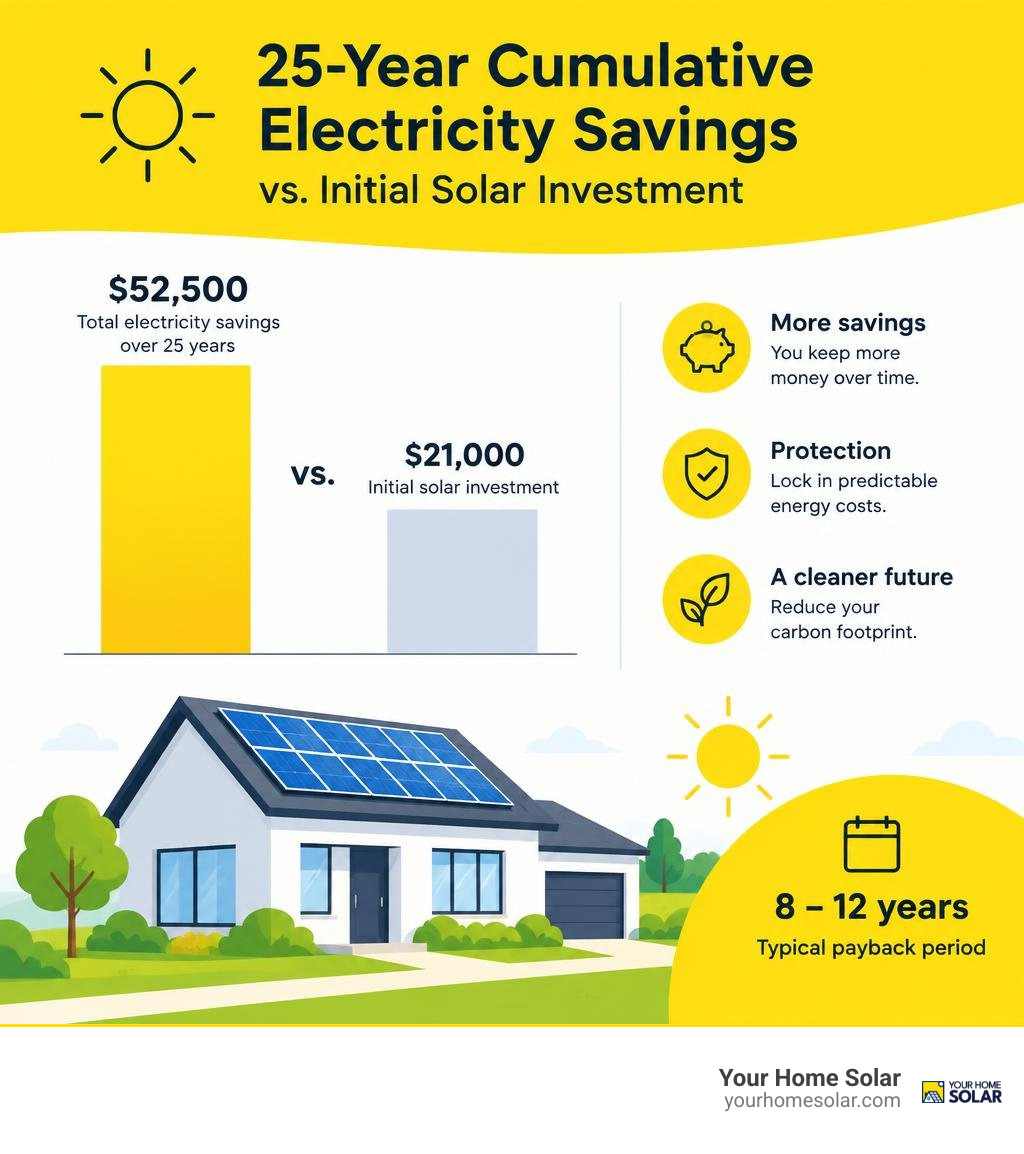
By producing your own clean energy on-site, you lock in predictable energy rates and shield your household from utility rate hikes for decades.
Financing Options and Incentives to Reduce Upfront Expenses
Securing the best return requires matching your payment structure to your financial goals. Exploring the cost and financing of solar systems allows you to choose between maximizing long-term lifetime savings or prioritizing immediate monthly cash flow.
Cash Purchases and Solar Loans
The two primary paths to system ownership are upfront cash purchases and specialized solar financing:
| Feature | Cash Purchase | Solar Loan |
|---|---|---|
| Upfront Capital Required | Full system cost | $0 down options available |
| Interest Expenses | None ($0) | Varies based on APR and loan term |
| 25-Year Net ROI | Maximum potential return | Moderate-to-high return |
| System Ownership | Immediate ownership | Immediate ownership (debt-financed) |
| Monthly Payment Impact | Replaces electric bill immediately | Loan payment replaces electric bill |
Homeowners who pay cash avoid finance fees and capture the fastest breakeven period. Solar loans allow you to transition to clean power with zero upfront capital, structuring fixed monthly loan payments that are often comparable to or lower than your previous electric bill.
State Rebates, Property Tax Exemptions, and Net Metering
Local policies and utility structures play a vital role in system economics:
- Net Metering and Interconnection: Many local utilities offer net billing or interconnection credits for surplus energy sent back to the grid during peak daylight hours. These credits help offset electricity drawn at night.
- Property Tax Protections: Adding a solar energy system increases your home’s market value, yet many local jurisdictions exempt the added value of renewable energy equipment from property tax assessments.
- Local Utility Incentives: Depending on your municipal utility or local power board, localized rebates or clean energy credits may be available to lower your net installation expenses.
Frequently Asked Questions About Solar Costs
What is the average cost to install solar panels on a standard home?
A standard residential solar system (typically 8 kW to 10 kW) averages between $20,000 and $29,000 before available local incentives. Gross pricing translates to approximately $2.50 to $3.00 per watt installed, covering all Tier 1 hardware, labor, permitting, electrical work, and utility interconnection.
How long does it take for solar panels to pay for themselves?
Most residential systems achieve full payback within 8 to 12 years. The exact timeline depends on your household energy usage, roof orientation, and local utility rates. Once the initial investment is recovered, the array continues generating clean electricity for the remainder of its 25- to 30-year lifespan.
Is installing solar panels worth the cost in 2026?
Yes. With electricity rates continuing to climb, solar provides a dependable hedge against utility inflation while increasing your home’s equity. Locking in your energy production costs today delivers substantial lifetime savings and builds long-term energy independence.
Conclusion
Investing in a home solar panel system is one of the most effective ways to lower your monthly utility expenses, insulate your home from volatile power prices, and take control of your energy future. Understanding the key factors behind system sizing, roof design, and component selection ensures you make a well-informed decision tailored to your home’s unique energy needs.
At Your Home Solar, we provide tailored, reliable, and rewarding energy solutions across East Tennessee, including solar arrays, standby backup generators, and EV charging stations. Backed by trusted expertise and a commitment to 100% customer satisfaction, our team ensures your transition to clean energy is seamless from start to finish. Contact us today to schedule a consultation for trusted solar installation in Knoxville, TN and receive a customized quote for your home.