
Solar Panel Cost in Powell, Tennessee: Compare Before You Sign
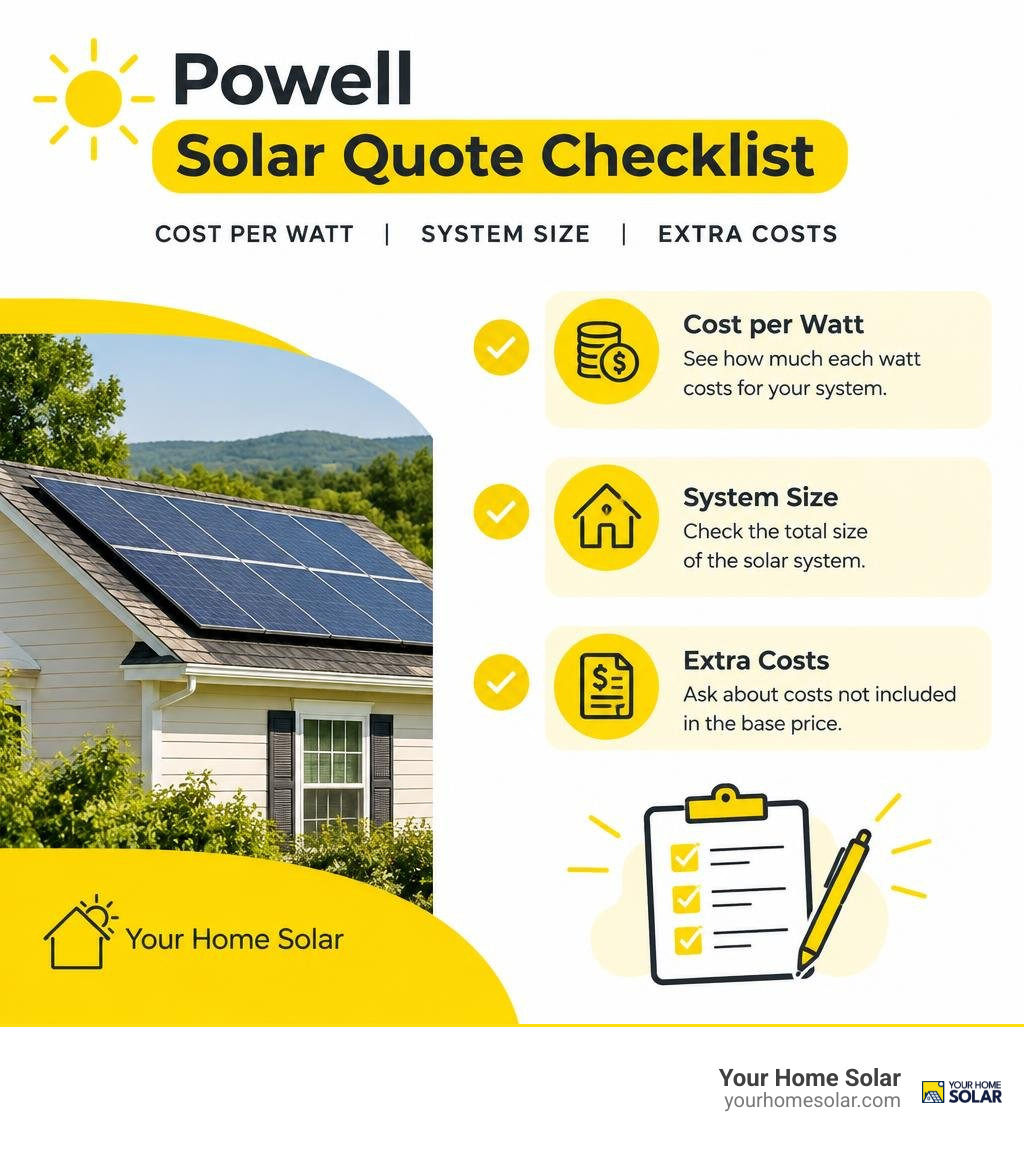
For an 8 kW system, start with a $23,600 national cost benchmark, then compare actual Powell quotes. That figure comes from a U.S. Department of Energy residential solar cost model, not a 2026 local price or an installer offer. Ask each installer for a cash price, system size, price per watt, expected yearly power output, and a list of costs not included. A lower total price may simply mean a smaller system.
I’m Ernie Bussell, founder of Your Home Solar, and I’ve managed solar installation operations in East Tennessee. That experience shapes how I help homeowners searching for “solar panel cost powell” compare proposals before signing.
Learn more about solar panel cost powell:
Understanding Average Solar Panel Cost in Powell
When reviewing contractor proposals, looking strictly at the bottom-line price tag can be misleading. A quote of $18,000 might seem far more appealing than a quote of $24,000 until you realize the first installer is quoting a tiny 4 kW array while the second is offering a complete 8 kW setup that offsets all your grid consumption.
To compare apples to apples, standardizing solar proposals using the price-per-watt metric is essential. In today’s market, residential turnkey installations generally range between $2.47 and $3.60 per watt before any custom site work or storage additions. Understanding whether a price around $3 per watt makes sense comes down to evaluating hardware quality, labor warranties, and contractor transparency.
According to modeled data from the DoE solar photovoltaic cost benchmarks, baseline hardware and installation costs for a standard residential array average around $2.95 per watt. Below is an overview of how residential systems scale across common property sizes:
| System Size (kW) | Approximate Upfront Cost Range | Estimated Annual Output (kWh) | Estimated 25-Year Utility Savings |
|---|---|---|---|
| 5 kW | $12,331 – $18,000 | 6,500 kWh | $22,000 – $28,000 |
| 8 kW | $19,760 – $28,800 | 10,400 kWh | $33,393 – $44,000 |
| 10 kW | $24,663 – $36,000 | 13,000 kWh | $48,000 – $58,000 |
| 12 kW | $29,595 – $40,000 | 15,600 kWh | $59,000 – $68,000 |
| 15.53 kW | $38,306 – $44,052 | 20,189 kWh | $77,185+ |
How System Sizing Dictates Solar Panel Cost in Powell
Every home has a unique energy footprint. Sizing your system correctly ensures you do not overspend on unneeded capacity or leave yourself vulnerable to excessive grid utility bills.
Checking solar panel costs in 2026 reveals that larger installations benefit from economies of scale. While fixed administrative and permitting expenses remain relatively constant, the marginal cost per added panel decreases as system capacity expands. By reviewing your previous twelve months of electric bills, we can accurately determine the exact kilowatt rating necessary to offset your household’s historical kilowatt-hour demand.
Hardware vs. Soft Costs: What You Are Actually Paying For
A solar installation estimate is composed of two primary categories: hard costs (physical equipment) and soft costs (labor, design, permitting, and overhead).
- Hard Costs (Roughly 45% of Total Invoice):
- High-efficiency Tier-1 monocrystalline panels
- Enphase microinverters or SolarEdge string inverters with DC optimizers
- Heavy-duty mounting rails, roof flashing, and electrical conduits
- Soft Costs (Roughly 55% of Total Invoice):
- Structural and electrical engineering review
- Local municipal building and electrical permitting
- Utility interconnection processing and grid synchronization
- Skilled on-site installation labor and multi-year workmanship guarantees
Physical module prices have dropped dramatically over the past few decades, as shown in historical solar PV module price tracking datasets. However, soft costs—including site engineering, certified electrical labor, and quality customer support—now make up the majority of the investment.
Key Factors That Influence Installation Expenses and Payback in Powell

Local geography, architectural styles, and weather patterns all shape total solar expenses. Homes in established neighborhoods with mature tree canopies face different design needs than newer construction subdivisions. Taking part in Powell’s clean energy transition requires an accurate assessment of how site-specific variables influence generation and return on investment.
Solar Production Potential and Local Sun Hours
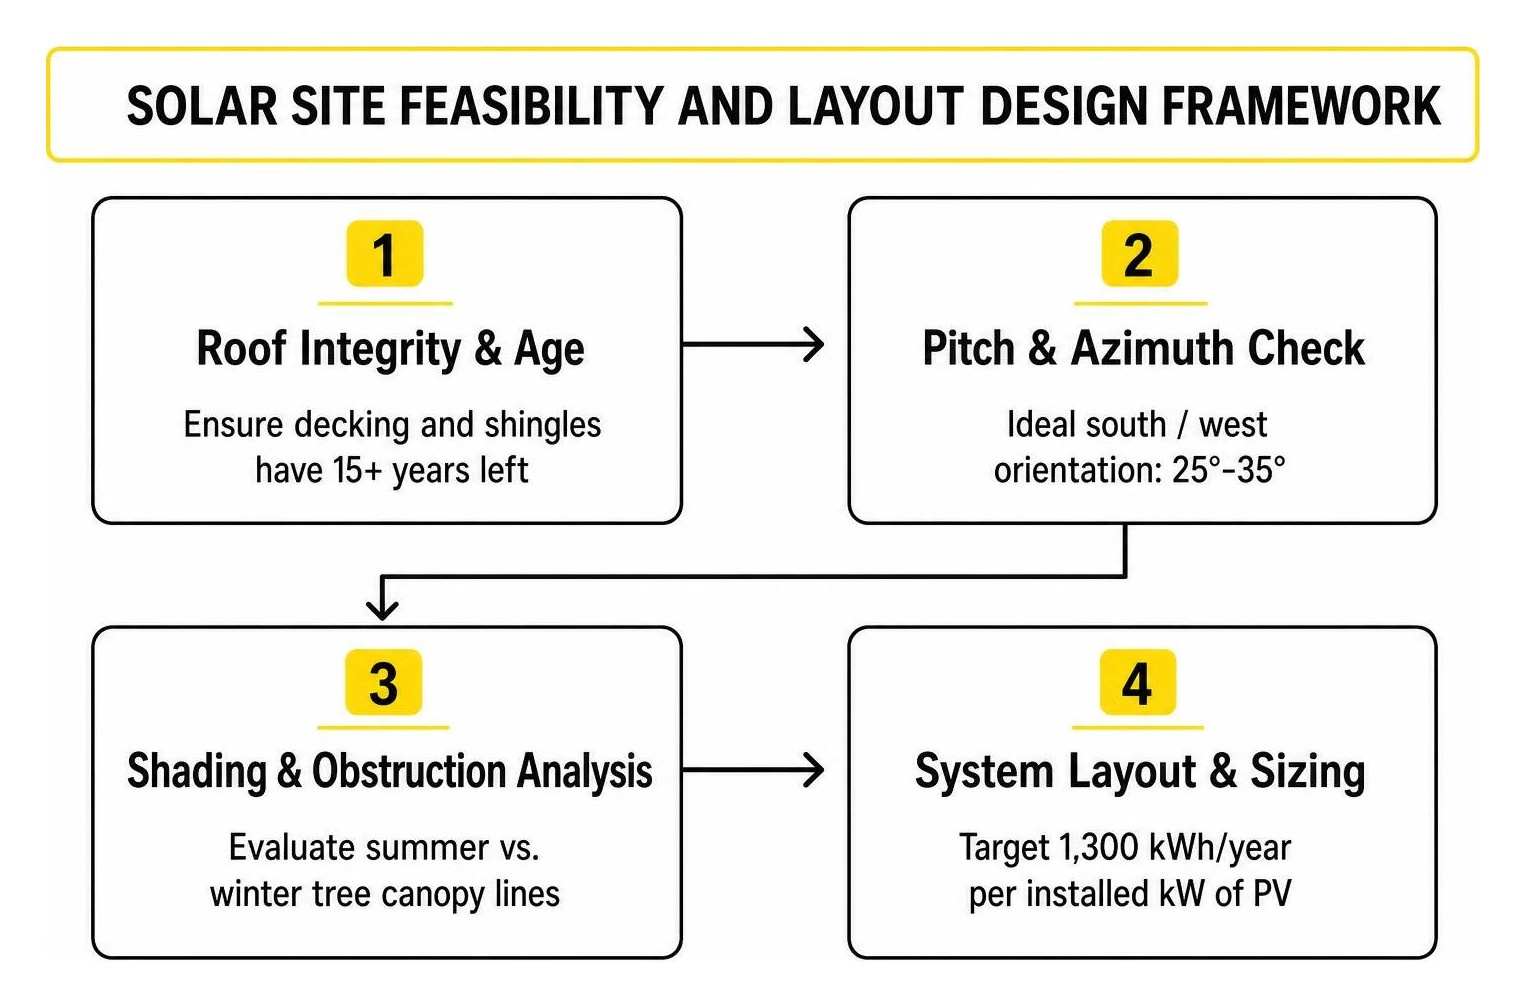
Powell receives an average of 4.6 peak sun hours per day. Under standard test conditions, each installed kilowatt of solar capacity reliably generates approximately 1,300 kWh of clean electricity annually.
Generation fluctuates naturally with the seasons. Production peaks during long summer days, generating substantial credit surpluses that help offset lower production during winter months when sun angles sit lower on the horizon.
Utility Policies and Electricity Rate Impact
Utility rates directly determine how much money your solar system saves every month. With residential electric rates averaging roughly 18.7¢ per kWh, every unit of electricity your rooftop array generates is power you do not have to purchase from the central grid.
When your system produces more energy during midday than your home consumes, excess power flows across your bi-directional utility meter to support the local electrical grid. Depending on specific local interconnection guidelines, these exported kilowatt-hours appear as financial credits on your monthly billing statement, helping lower your total annual utility expenses.
Uncovering Hidden Expenses in Residential Solar Quotes
A common frustration among property owners is receiving a seemingly low upfront bid, only to be hit with unexpected change orders right before installation. When evaluating contractor proposals, make sure your initial quote accounts for site-readiness requirements:
Pre-Installation Site Readiness: Electrical and Structural Upgrades
- Main Electrical Service Panel Upgrades: Older homes equipped with 100-amp or 150-amp electrical panels frequently require a service upgrade to 200 amps to safely handle backfed solar current, which typically adds $1,500 to $4,000.
- Roof Age and Structural Decking: If your architectural asphalt shingles have fewer than five to ten years of remaining service life, replacing the roof before installing solar prevents paying $4,000 to $6,000 later to detach and reset the panels.
- Tree Trimming and Foliage Management: Clearing overhanging branches along south- and west-facing roof planes optimizes panel irradiance and prevents debris accumulation.
- Critter Guard Barriers: Installing durable, vinyl-coated wire mesh around the array perimeter protects underlying wiring harnesses from nesting birds and squirrels.
Generator Backup Add-Ons
While standard grid-tied solar systems automatically disconnect during power outages for line-worker safety, pairing solar with a whole-home standby generator provides continuous power.
For homeowners wanting immediate backup during severe storms, installing a 5kW solar system with battery backup or a whole-home standby generator ensures essential loads—including refrigeration, medical equipment, and HVAC systems—remain fully operational regardless of grid reliability.
Financing Options, Incentives, and Calculating Your Long-Term ROI
Evaluating your solar investment involves weighing upfront capital expenditures against long-term operational savings. Homeowners have access to multiple flexible payment options to match their financial goals:
| Financing Method | Upfront Out-of-Pocket | Monthly Payment Structure | Long-Term Ownership & Equity | Ideal For |
|---|---|---|---|---|
| Direct Cash Purchase | 100% at project milestones | $0.00 | Complete system ownership; maximum 25-year return | Homeowners seeking the highest overall financial return |
| Secured / Unsecured Solar Loan | $0 to minimal down payment | Fixed monthly payment ($150 – $310) | Homeowner owns the asset; loan is paid off over 10–20 years | Homeowners looking to swap their electric bill for fixed asset payments |
| Standby Generator Hybrid Financing | Tailored to equipment size | Integrated with solar loan package | Homeowner owns both renewable and emergency generation assets | Properties requiring uninterruptible power security |
2026 Incentive Landscape and Tax Policies
The residential clean energy landscape shifted significantly after the federal Section 25D tax credit expired for installations completed after December 31, 2025. Today, solar economics rely on direct energy offset value and local utility programs rather than temporary federal subsidies.
Homeowners should search the Database of State Incentives for Renewables and Efficiency (DSIRE) and consult with certified local installers to identify available utility rebates, property tax exemptions, or energy efficiency credits.
Evaluating Payback Periods and Long-Term Solar Panel Cost in Powell
A properly engineered residential solar array in our region typically achieves a full financial break-even within 9.78 to 13.1 years. Over a standard 25-year equipment warranty period, net avoided electricity costs generally total between $33,393 and $77,185.
Beyond direct energy savings, owned solar arrays enhance residential property value and serve as a reliable financial hedge against long-term electric utility rate inflation.
Frequently Asked Questions About Solar Panel Costs in Powell
What is the average payback period for a residential solar system in Powell?
The typical payback period ranges between 9.78 and 13.1 years. The exact timeline depends on total system capacity, roof azimuth, household consumption habits, and retail electricity rates. Systems designed to offset 90% to 100% of daytime consumption deliver the fastest financial return.
How do I avoid overpaying for solar installation?
Request itemized quotes from established local contractors that clearly state system wattage, panel efficiency ratings, inverter specifications, and guaranteed labor warranties. Standardize bids using the cost-per-watt metric and ask whether necessary structural or electrical service panel upgrades are included in the proposal.
Are solar panels worth the investment in 2026 without federal tax credits?
Yes. With residential electricity rates averaging 18.7¢ per kWh, a standard 8 kW solar installation generates roughly 10,400 kWh annually, delivering substantial first-year utility bill savings and more than $33,000 in net savings over its warrantied lifespan.
Conclusion
Installing home solar is one of the most effective ways to lower your ongoing monthly utility bills and take control of your long-term energy needs. Before signing an installation contract, take the time to evaluate detailed cost-per-watt figures, examine equipment specifications, and make sure your roof and electrical panel are ready for solar.
At Your Home Solar, we take pride in delivering customized residential solar installations, standby backup generators, and smart EV charging solutions throughout East Tennessee. Our team focuses on transparent engineering, clear project guidance, and long-term customer satisfaction.
When you are ready to evaluate your home’s solar potential, partner with the top solar installer in the region to secure clean, dependable energy for decades to come.