Average Cost to Solar Power House Systems in 2026
When examining the average cost to solar power house installations across Tennessee, headline numbers can vary wildly. Understanding industry pricing standards makes evaluating quotes far easier. Rather than looking only at total contract prices, industry professionals assess system pricing on a cost-per-watt ($/W) basis.
National benchmark pricing for residential solar sits between $2.50 and $3.50 per watt installed for direct cash purchases. To calculate your gross estimate using a Solar Panel Cost Calculator 2026 — Free Estimate by State | CostPrism, simply multiply your target system capacity in watts by your local per-watt installation rate.
For example, an 8,000-watt (8 kW) array priced at $2.75 per watt yields an estimated gross cost of $22,000.
Baseline System Sizing and Average Cost to Solar Power House Installations
Most standard residential systems range from 6 kW to 10 kW, with 7 to 8 kW serving as the average size for a single-family residence. According to data on Solar Panel Cost for a 1,800 sq ft Home (2026) | Green Energy Calculators, an 8 kW system provides a reliable baseline for average domestic power needs.
| System Capacity (kW) | Total Panel Count (400W Modules) | Price Range ($2.50–$3.50/W) | Average Installed Cost |
|---|---|---|---|
| 5 kW | 13 panels | $12,500 – $17,500 | $15,000 |
| 7 kW | 18 panels | $17,500 – $24,500 | $21,000 |
| 8 kW | 20 panels | $20,000 – $28,000 | $22,000 |
| 10 kW | 25 panels | $25,000 – $35,000 | $30,000 |
| 12 kW | 30 panels | $30,000 – $42,000 | $36,000 |
Larger systems benefit from minor economies of scale. Smaller 4 kW to 5 kW arrays often hover around $2.89 to $3.50 per watt due to fixed administrative overhead, while 12 kW to 15 kW arrays frequently drop closer to $2.47 to $2.60 per watt.
How System Size and Square Footage Scaling Impact Total Price
A common mistake homeowners make is assuming square footage directly dictates solar pricing. Floor space is only a broad proxy; annual electricity usage measured in kilowatt-hours (kWh) determines true system size.
A 1,500-square-foot home with all-electric heating, a hot tub, and an electric vehicle (EV) charger often consumes significantly more power than a 3,000-square-foot home heated with natural gas.
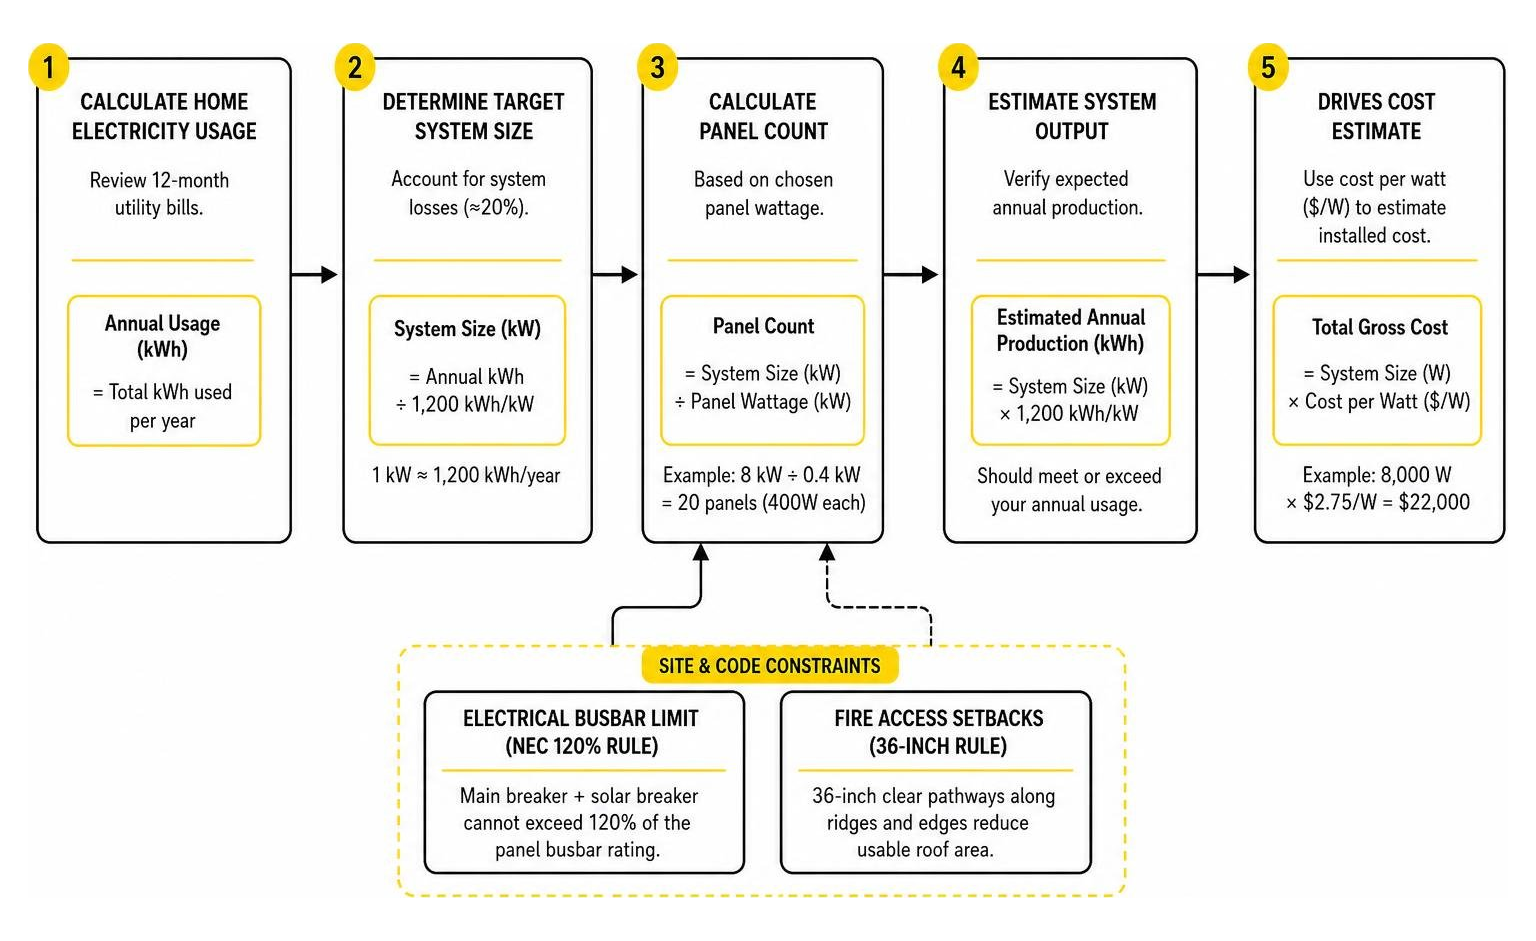
Physical site limitations also dictate system size:
- Electrical Busbar Constraints (NEC 120% Rule): The National Electrical Code (NEC 705.12) dictates that the sum of the main utility breaker and solar input breaker cannot exceed 120% of your electrical panel’s busbar rating. Exceeding this threshold requires an electrical main panel upgrade.
- Fire Access Setbacks (36-Inch Rule): Building codes require 36-inch pathways along roof ridges and edges for firefighter access, reducing total usable array area regardless of home square footage.
Components Driving the Cost to Solar Power House Installations

When reviewing a contract, many assume the physical hardware accounts for the vast majority of the price tag. In reality, equipment accounts for less than half of your total invoice. Understanding these cost drivers clarifies what you pay for. To explore these dynamics in detail, review An Essential Guide to Solar Panels Cost.
Physical Hardware Costs: Panels, Inverters, and Racking
The physical gear mounted to your home comprises roughly 35% to 40% of overall project expenses:
- Solar Panels (12% of Total Cost): Photovoltaic (PV) modules account for roughly 12% of system costs (around $3,700 on a $31,000 system). Premium monocrystalline panels cost more upfront than mid-tier options, but deliver higher efficiency and better performance in limited spaces.
- Inverters and Optimizers (10% to 20% of Total Cost): Inverters convert direct current (DC) power generated by panels into usable alternating current (AC) power.
- String Inverters: Centralized units with lower upfront costs, best suited for unshaded, uniform roofs.
- Microinverters & Power Optimizers: Module-level power electronics attached to individual panels. They cost $0.10 to $0.30 per watt more, but optimize power yield when panels experience partial shading or face different directions.
- Racking and Supply Logistics (12% of Total Cost): Heavy-duty aluminum mounting rails, roof flashings, copper wiring, conduits, and supply chain shipping fees make up the remainder of hardware costs.
Soft Costs, Permitting, and Installation Labor
“Soft costs”—operational expenses outside physical hardware—represent 60% to 65% of residential solar pricing in the United States.
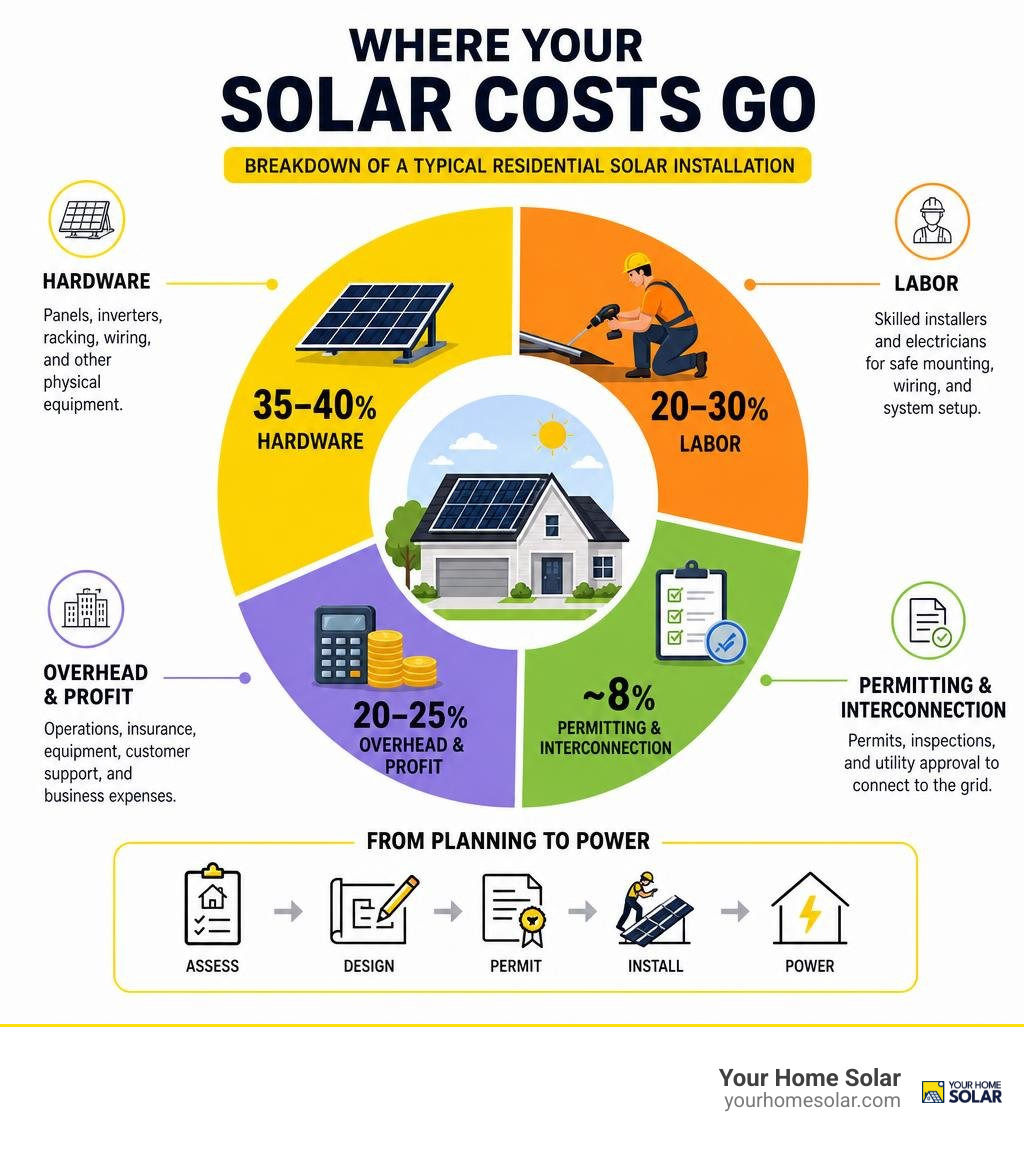
These expenses cover critical expertise and local compliance:
- Sales, Marketing, and Customer Service (18%): Customer acquisition, site assessments, and energy modeling.
- Installer Overhead and Margin (22%): Operations, insurance, licensing, warehouse space, and specialized equipment.
- Labor (7% to 25%): Certified electricians and installers handling high-voltage wiring, structural mounting, and roof sealing.
- Permitting and Interconnection (8%): City/county building permits, electrical inspections, and utility grid interconnection processing.
Incentives, Financing Models, and Payback Timelines
The financial landscape for residential clean energy has shifted significantly. The 30% federal residential solar tax credit (Section 25D) expired on December 31, 2025. Today, financial evaluations rely on local utility structures, retail electricity rates, and private financing options. Learn more in our guide on the Cost and Financing of Solar Systems.
Cash, Solar Loans, and Leases or PPAs
How you choose to fund your installation impacts long-term return on investment:
- Cash Purchase: Offers the absolute highest 25-year return. Eliminating interest fees maximizes utility bill savings, though it requires full upfront capital.
- Solar Loans: Secured (like HELOCs) or unsecured solar loans allow $0-down installation. Beware of loan reamortization structures; without voluntary principal prepayments, monthly terms can reamortize higher.
- Leases and Power Purchase Agreements (PPAs): Third-party companies retain ownership of the panels and sell you the generated electricity at a set rate. While offering low upfront costs, third-party leases yield significantly lower long-term savings than direct ownership and can complicate future real estate sales.
Payback Timeline and Factors Influencing ROI
The average residential solar payback period in the U.S. spans 7 to 12 years. Detailed calculations are available at Solar Installation Cost 2026: Per-Watt & Payback | TRB.
Primary variables shaping your payback timeline include:
- Utility Electricity Rates: High utility electricity prices shorten payback timelines. A home paying $0.18/kWh recovers system costs far faster than a home paying $0.10/kWh.
- Net Metering Policies: Utility rules for crediting excess solar electricity sent back to the grid directly impact monthly ROI. Full retail credit policies maximize returns, whereas wholesale or avoided-cost export rates encourage adding battery storage to capture power locally.
- Local Solar Irradiance: Homes in areas with high annual sun hours generate more total kilowatt-hours per installed kW array.
Additional and Ongoing Residential Solar Expenses
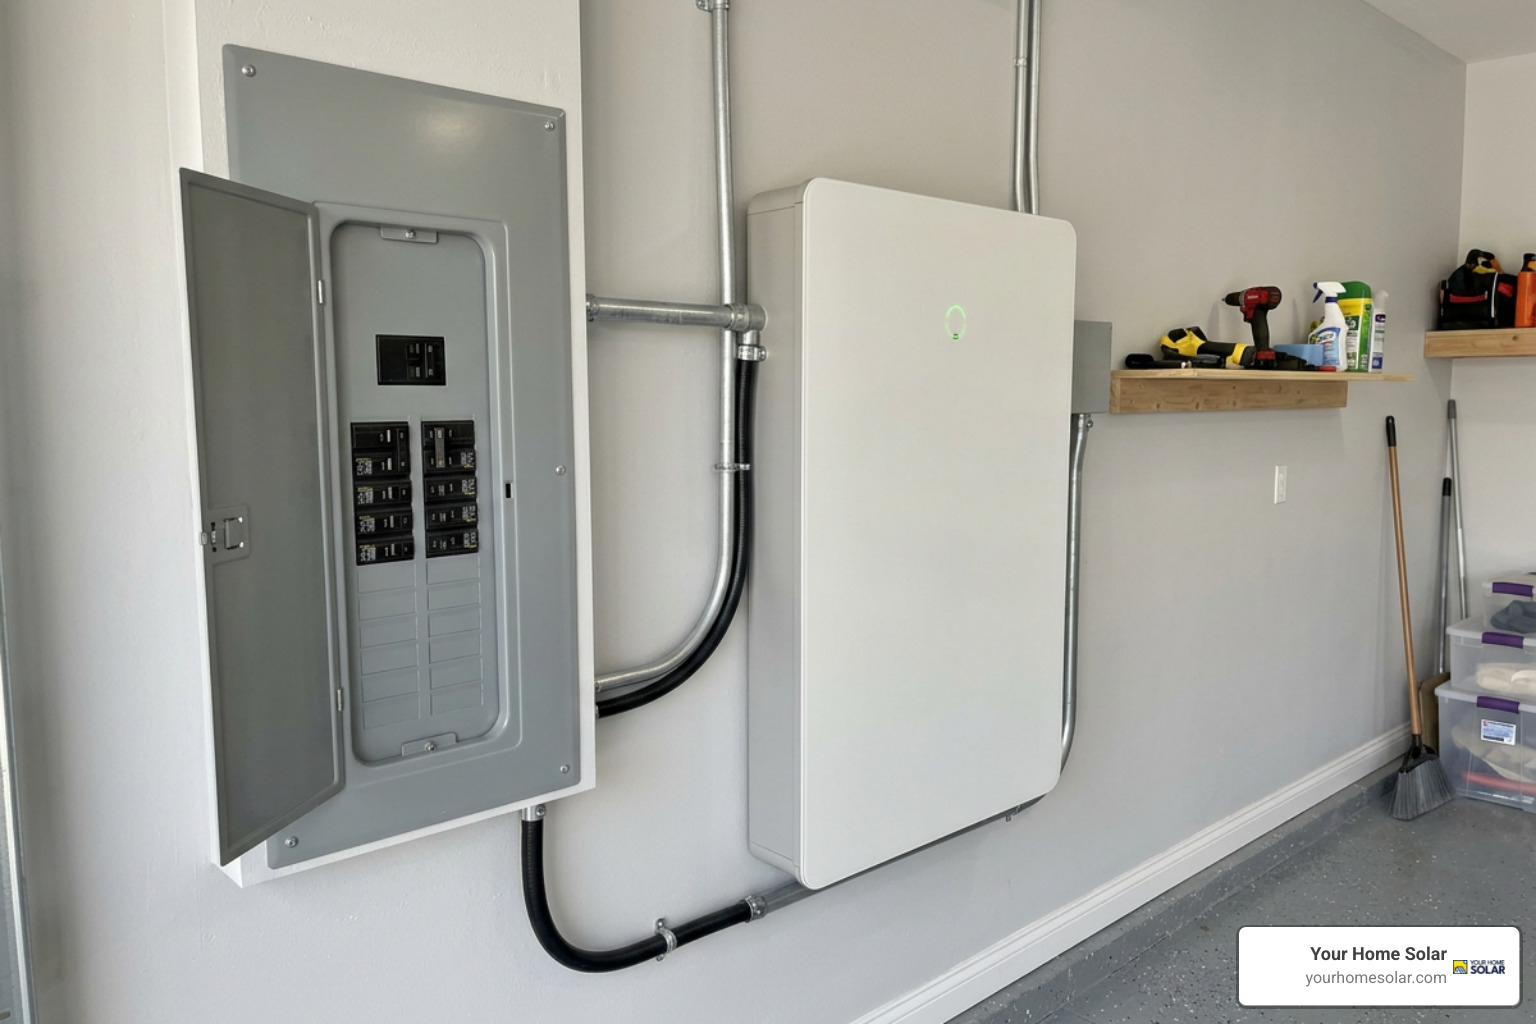
When calculating the total cost to solar power house systems, factor in site preparation, storage additions, and long-term maintenance. Read our breakdown on Your Solar Budget: What to Expect for Home Installation Costs to avoid budget surprises.
Battery Backup Systems and Main Electrical Panel Upgrades
Adding energy storage or upgrading home electrical infrastructure increases initial project costs:
- Battery Storage ($10,000 – $15,000): Adding a 10 kWh to 13.5 kWh battery system provides backup power during grid outages and helps avoid high peak rates under Time-of-Use (TOU) utility plans.
- Electrical Service Panel Upgrades ($1,500 – $4,500): Older 100-amp or 150-amp electrical panels often need upgrading to 200 amps to safely handle new solar breaker inputs under national electrical codes.
- EV Charger Circuits ($800 – $1,800): Many homeowners add a dedicated 240V Level 2 EV charging circuit during solar installation to combine labor expenses.
Long-Term Maintenance, Inverter Replacements, and Roof Work
Ongoing operational expenses for rooftop solar remain remarkably low:
- Panel Maintenance and Cleaning: Solar panels have no moving parts. Normal rain washes away most dust and pollen. Rinsing heavy debris with water once or twice a year is typically all that is needed.
- Inverter Replacements (Years 10–15): While solar panels carry 25-year performance warranties, central string inverters typically last 10 to 15 years. Budgeting $1,000 to $2,500 for a mid-life inverter replacement ensures long-term system reliability.
- Pre-Installation Roof Condition: Solar panels last 25 to 30 years. If your asphalt shingle roof is older than 10 to 15 years, replace it before installing solar. Removing and re-installing an array for a future reroofing project can cost between $2,500 and $7,000 in extra labor fees.
Frequently Asked Questions About Home Solar Costs
How long does it take for solar panels to pay for themselves in 2026?
Most residential systems pay for themselves within 7 to 10 years when purchased directly. Once the payback milestone is hit, your solar system generates virtually free electricity for the remainder of its 25- to 30-year operational life.
How much do solar panels increase home resale value?
Studies consistently show owned residential solar systems increase home market values by 3% to 4% (an average premium of roughly $15,000). Buyers value lowered monthly utility costs, making solar-equipped homes sell faster than non-solar properties.
Is solar power still worth the cost without the federal tax credit?
Yes. Electricity rates continue to rise over time. Over a 25-year lifecycle, a typical residential solar array generates $41,000 to $155,000 in cumulative energy savings, far outweighing the initial system purchase price.
Conclusion
Understanding the true cost to solar power house systems involves looking beyond quick quotes. By evaluating cost per watt, equipment efficiency, warranty terms, and site requirements, you can build a clean energy solution tailored specifically to your home’s needs.
At Your Home Solar, we provide home energy solutions across East Tennessee, including solar installations, battery backup systems, and EV chargers. Servicing Knox, Sevier, Blount, Sullivan, Washington, and surrounding counties, our expert team focuses on reliable installations tailored to your household.
Ready to discover your home’s solar potential and calculate lifetime savings? Explore Custom Residential Solar Systems today and get a personalized estimate for your property.